This article is about the key metrics that are good to know about your building project, and what these should be if you want to make sure that your scheme is sustainable.
There are many figures and acronyms that people in the construction industry use, particularly when discussing the sustainability of a scheme. It can be difficult to fully grasp what each metric is measuring, why is it important, and what ‘good’ looks like. So here is a summary of seven key sustainable metrics for a project. I would add that these are only one measure of a project’s success. A critical omission from the below list for example is community engagement and social value which are less easy to define into clearly comparable target structures. I would also add that it is impossible to cover every metric and I have intentionally not covered SAP, SBEM and on-site renewables. I promise these will all be in a future article. So without any further ado here are my top seven sustainable numbers:
1) EUI
EUI stands for Energy Use Intensity and is a measure of how much total energy a building uses in one year per square metre. The units of measure are kWh/m2/yr so you would calculate this figure as follows:
- Total energy (regulated and unregulated) used by a building in a year in kWh
- Divided by the Gross Internal Area (GIA) of a building in m2
So an EUI includes both the energy for heating, cooling and all fixed installations in a building as well as equipment like computers, fridges, washing machines, lifts. Essentially it is telling you how efficient a building is (similar to the old fashioned ‘miles per gallon’ for a car). The reason for using an energy measure here (instead of carbon) is to allow comparison of different project’s energy efficiency without worrying about their energy source.
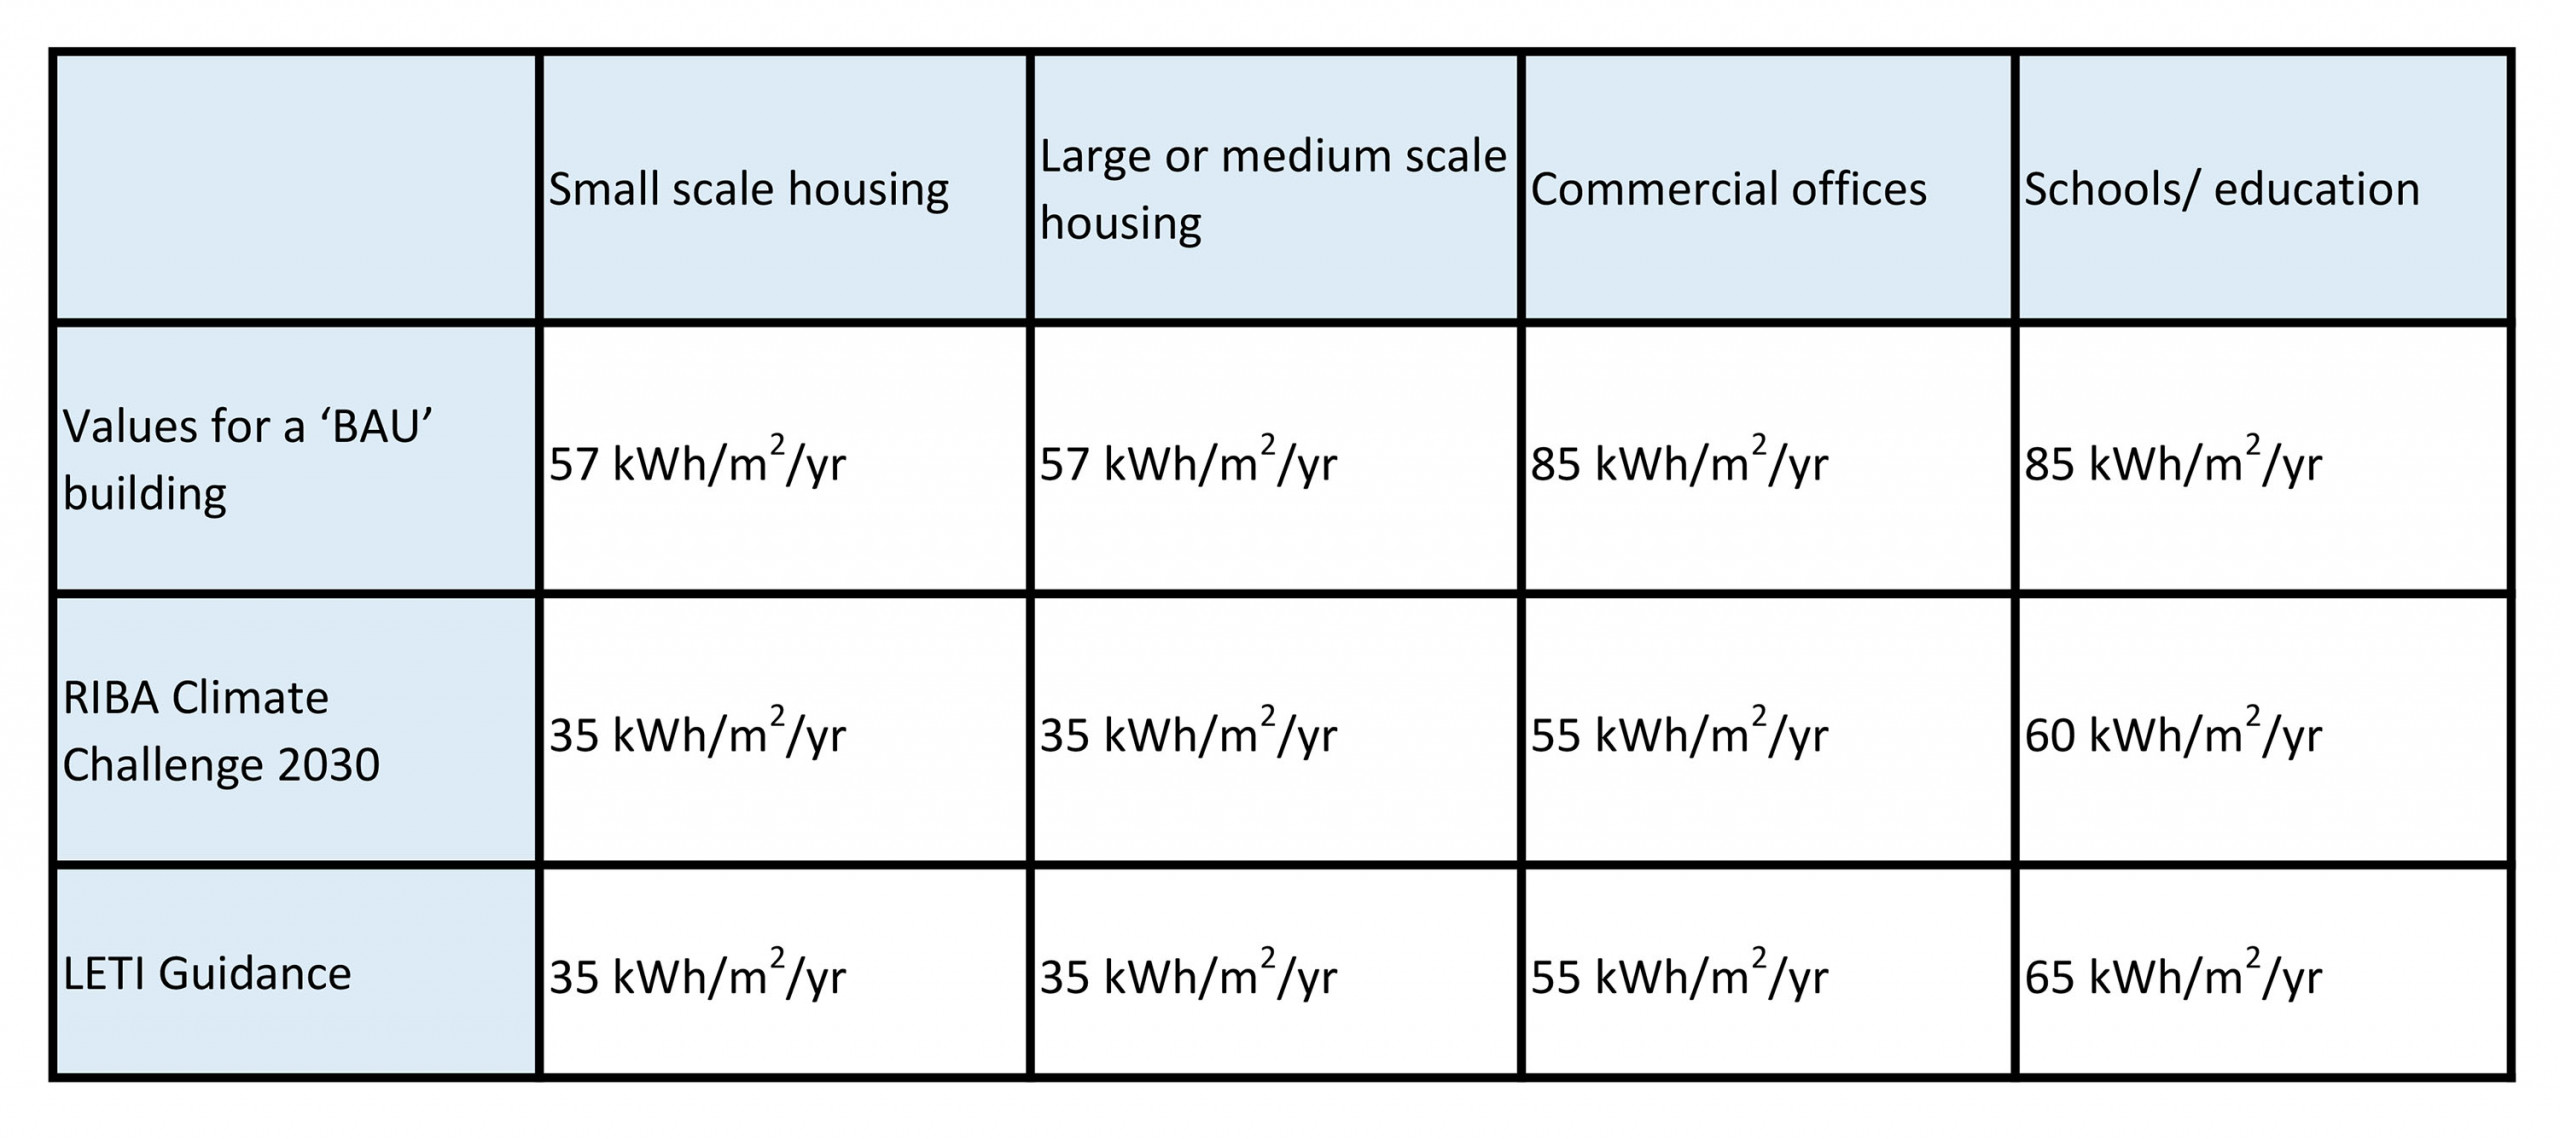
Below is a table showing what a Business as Usual (BAU) building regulations project would probably achieve for an EUI compared to Best Practice EUI taken from the RIBA Climate Challenge 2030 and the Low Energy Transformation Initiative (LETI) Climate Emergency Design Guide:

To predict your EUI during the design process for a project you will need to work with your MEP Consultant to estimate the total energy use of the building per year. Obviously if your building exists you should be able to use meter readings.
In the UK we are aiming for net zero operational carbon emissions. It should be noted that this does not mean that the building will not use any energy, as you can see in the above EUI figures. Rather it means that the energy the building uses will be sourced renewably and ideally partially or totally generated on site, with no carbon impacts. With current technology this means an electric based system.
2) U-Values
U-Values are a measure of how well elements of a building’s external fabric are insulated, sometimes referred to as ‘thermal transmittance’. The units of measure are W/m2K ie:
- Rate of energy loss in Watts
- Divided by the area of the element
- Multiplied by the K-value which is the thermal conductivity of a material
Normally U-Values are single figures given for each external fabric element, like walls, roof, windows etc. Each one of these fabric elements consists of multiple layers of materials, so normally you would calculate a U-Value by inputting the thickness of each layer and material K-Value into an online calculator or Excel spreadsheet to get a total U-Value. The lower a U-Value is, the better it will insulate a building.
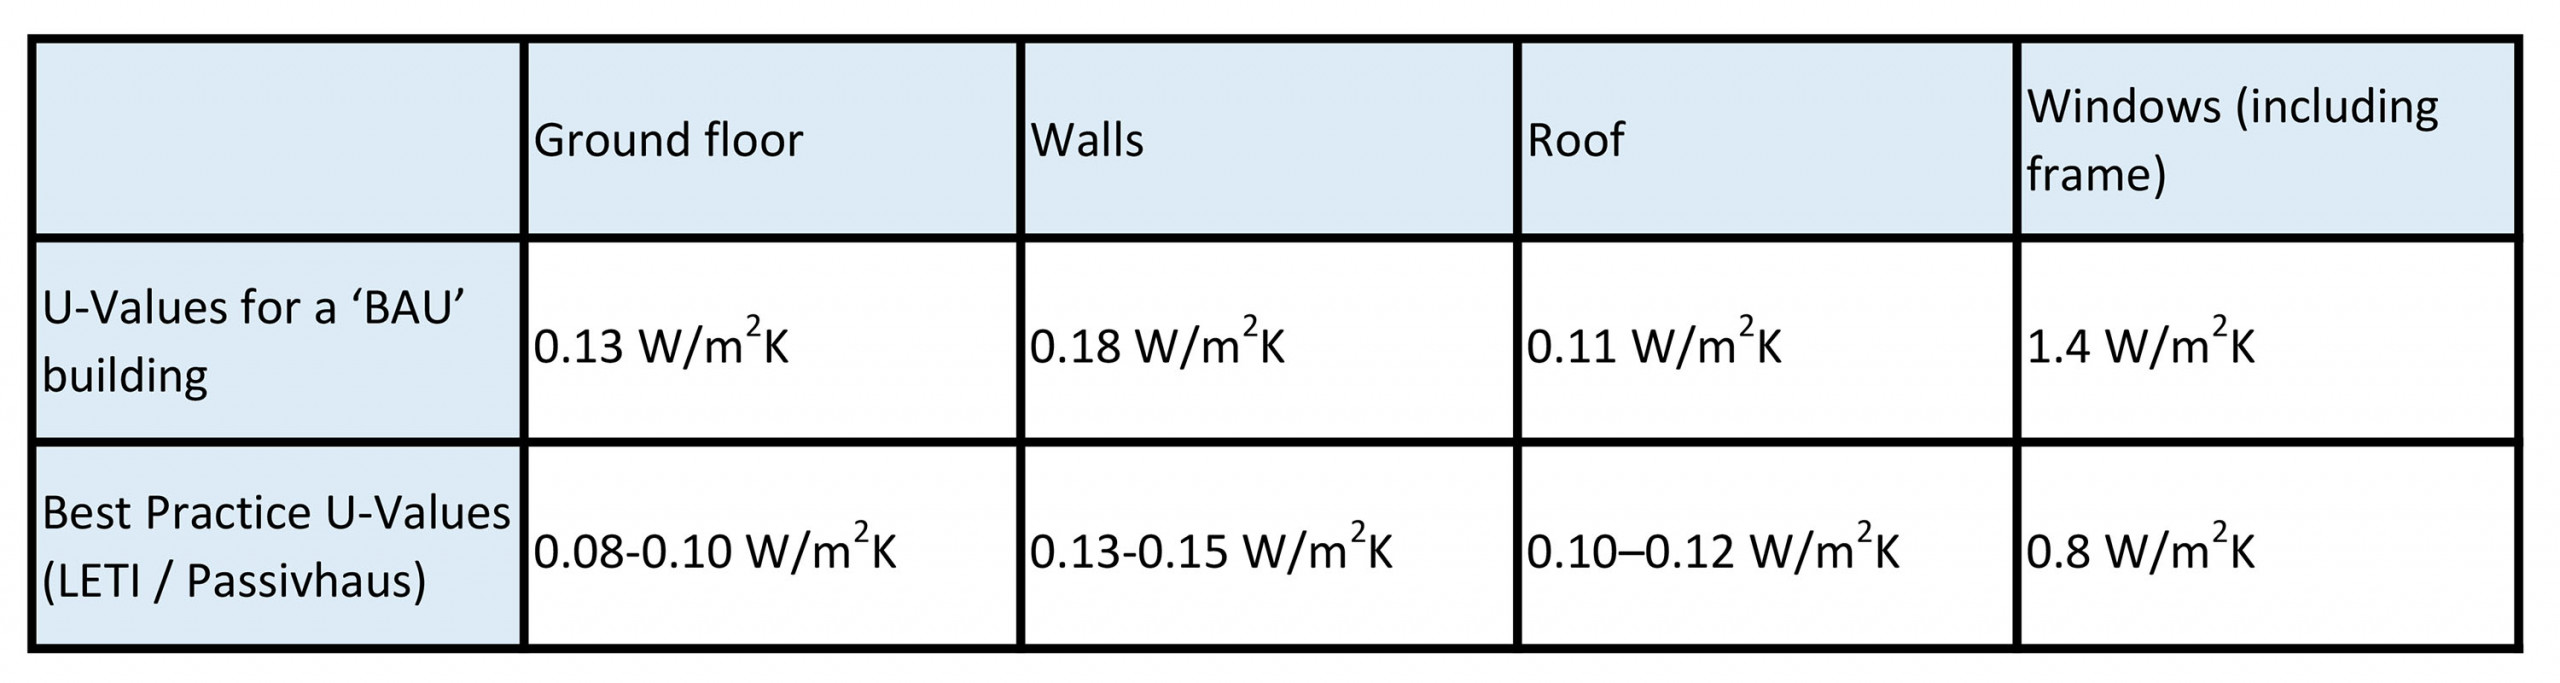
Below is a table showing what a Business as Usual (BAU) Building Regulations project would achieve for U-Values compared to Best Practice typically required to meet LETI or Passivhaus targets. Please note for simplicity this is for a new-build project, there is more flexibility for refurbishments (although the Best Practice targets are still good to aim for):

Your Architect or MEP/Sustainability consultant should be able to calculate and tell you what the U-Values are for different elements of your project.
3) Air-tightness
Air-tightness is essentially a measure of how much a building will limit uncontrolled leakage of outdoor air through cracks or unintended openings. The unit of measure which we use for Building Regulations in the UK is q50 which is m3/hm2@50Pa ie:
- The volume of air lost per hour in cubic metres
- Per square metre of envelope area
- At 50 Pascals of pressure
It is worth noting that the Passivhaus Institute recommends using a different unit called n50 which is ACH@50Pa ie:
- The number of times the entire volume of air in a building changes per hour (ACH)
- At 50 Pascals of pressure
Nearly all buildings in the UK at the end of a construction project need to have an air-tightness test. For this you close all windows and block all vents in the building (the measure excludes these), and then a specialist operator places a fan in a door or window and sucks air out. The fan operator notes the amount of airflow which tells them the air-tightness. This is very important to ensure that you do not lose heat or coolth in a building in an uncontrolled fashion. It is particularly important for very energy efficient buildings that use a Mechanical Ventilation Heat Recovery system (MVHR). Normally at the design stage of a project there is a predicted air-tightness value, and as a designer you must communicate at the specification stage of the project what this is and how to achieve it with careful construction.
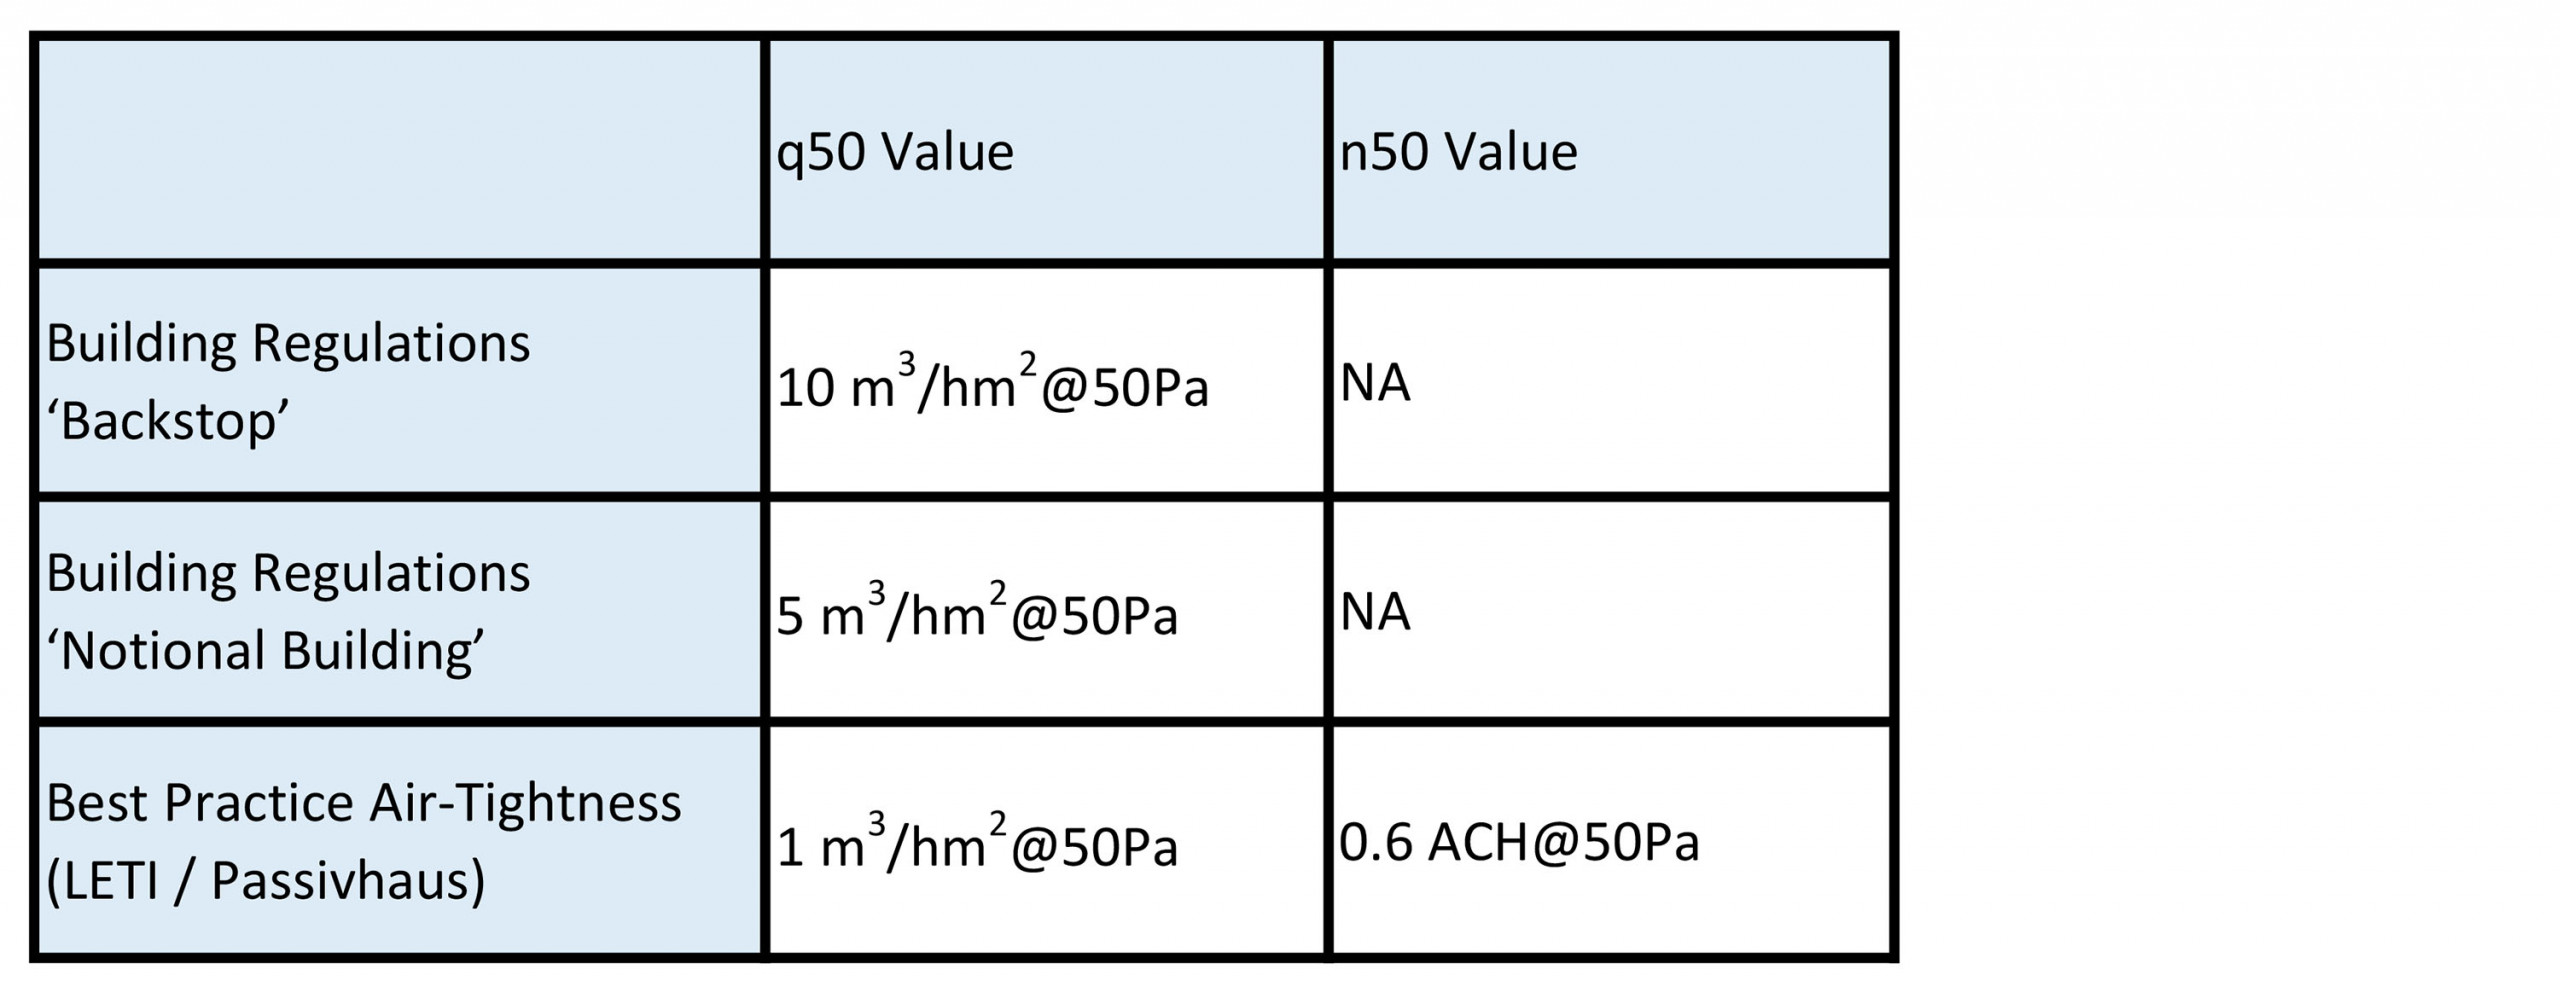
Below is a table showing what a Business as Usual (BAU) building regulations project would achieve for Air-Tightness compared to Best Practice typically required to meet LETI or Passivhaus targets. Please note once again for simplicity this is for a new-build project, there is normally more flexibility in retrofits and refurbishments:

At the design stage your Architect or MEP/Sustainability Consultant should be able to tell you what the predicted air-tightness of your project is. At the end of the project the air-tightness test will give you the actual figure for the scheme.
4) Embodied Carbon
Embodied carbon is a measure of the total carbon/greenhouse gases (GHG) that have been released into the atmosphere as a result of the construction and maintenance process. The units for this measure are kgCO2eq/m2 ie:
- The weight of CO2 or equivalent greenhouse gases released
- Per Gross Internal Area of a building (GIA) in m2
There are two potential values for this figure, the ‘Upfront’ figure and the ‘Whole Life’ figure. Upfront Embodied Carbon is all the emissions associated with the construction of the building or project up to its completion and occupation (ie extraction, manufacture, installation and construction). Whole Life Embodied Carbon is all of the carbon emissions associated during its lifetime (normally assumed to be 60 years) excluding operational carbon. The reason that both figures can be important to understand is so that you ensure any carbon savings made through materials choices at first do not have a great impact later on due to maintenance or durability concerns. See section 5 of this article to understand more about Whole Life Carbon.
Buildings for different sectors can have different requirements meaning only certain embodied carbon targets are achievable. Please see a table below showing upfront carbon embodied targets for Business as Usual (BAU), LETI and RIBA Climate Challenge 2030 targets:

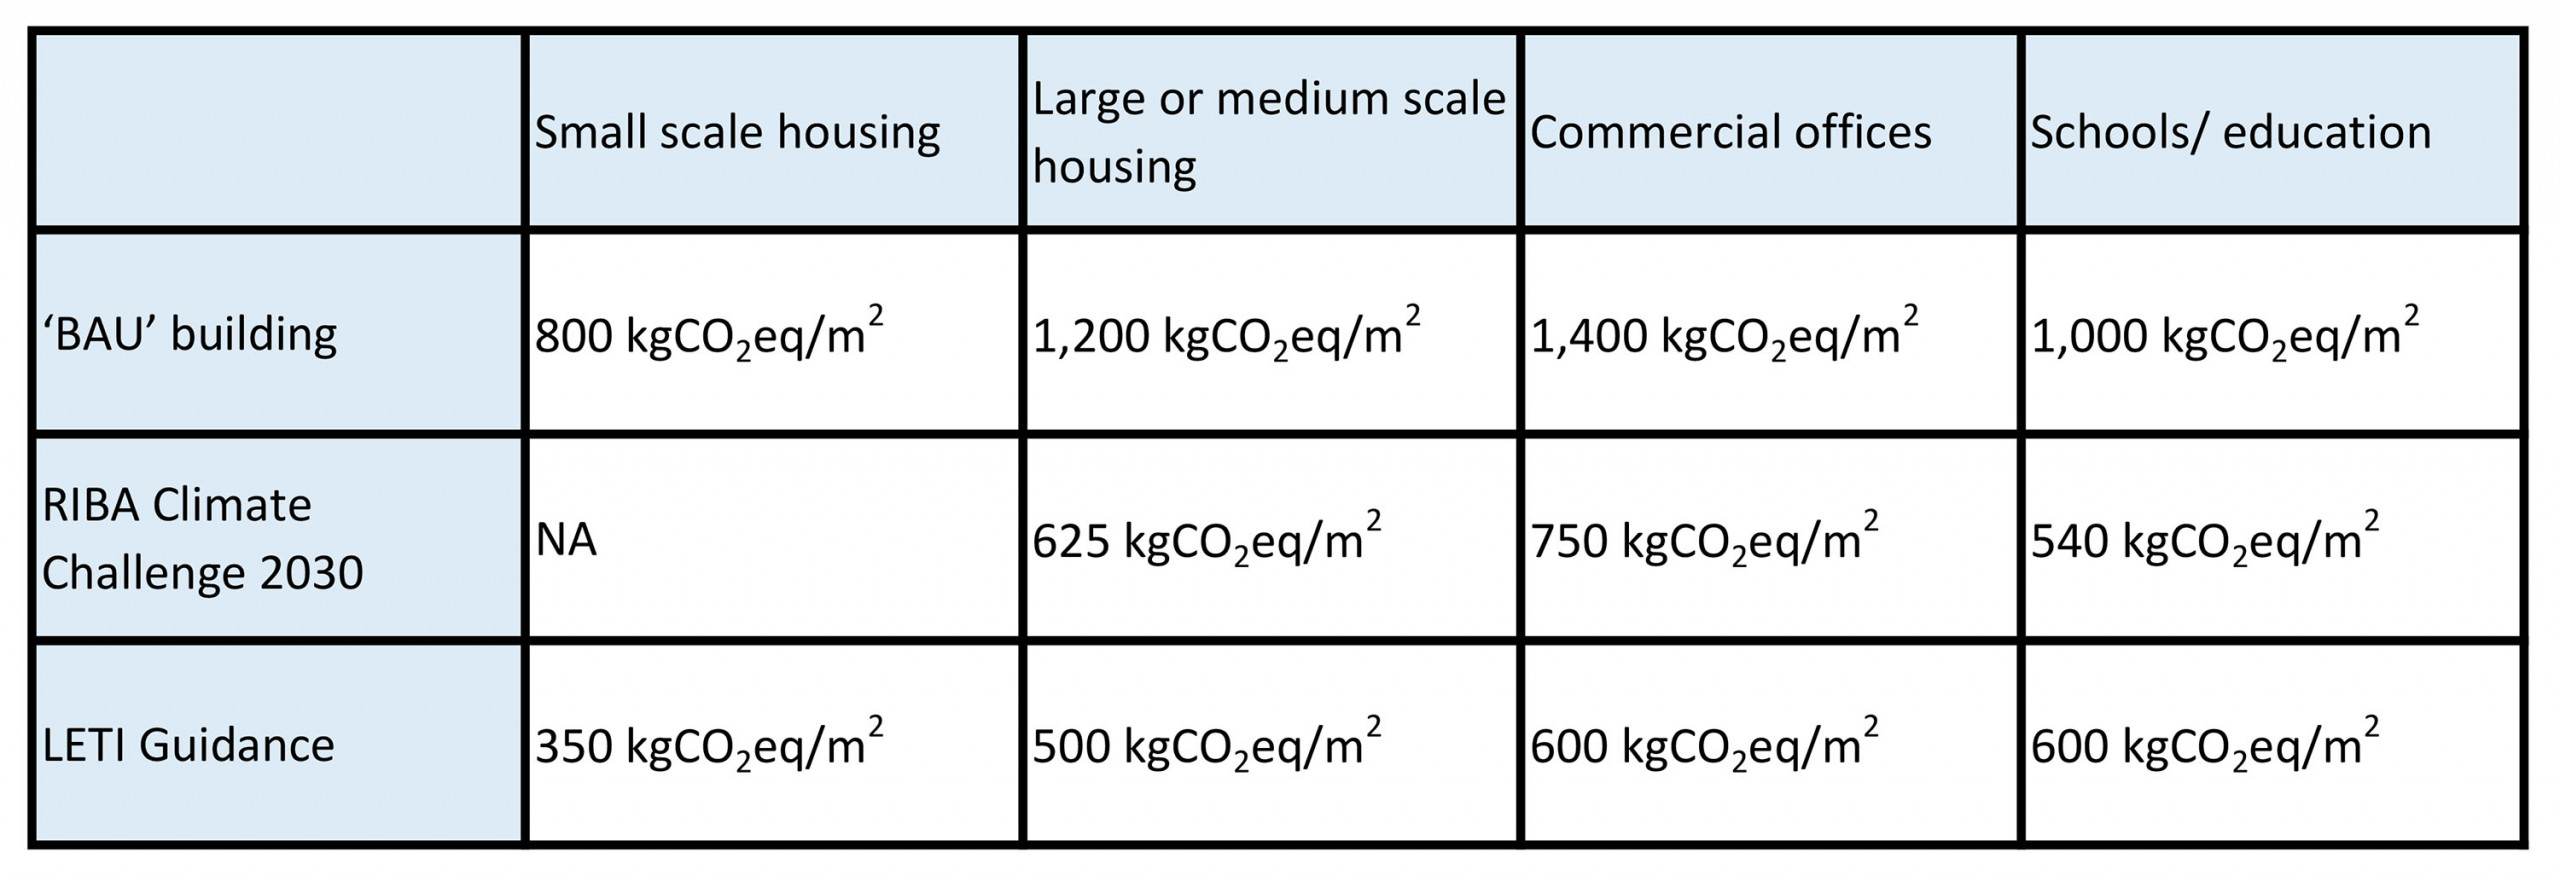
For simplicity the above figures are for new-build structures. Refurbishments and retrofits should have lower embodied carbon as you are using an existing structure. Whilst embodied carbon is only required to be measured for large buildings in London (as part of the London Plan) it is almost certain that this will become a statutory requirement in the future which should mean more buildings being retained and refurbished.
Your Architect, Quantity Surveyor or Structural Engineer should be able to calculate your embodied energy figure during the design stage of the project. This is based on quantities of materials and their carbon content so the figure will be more accurate as more detailed design information becomes available.
5) Whole Life Carbon
Whole life carbon is the total carbon emissions of a building or project over its entire lifespan, normally defined as 60 years (except for infrastructure which is 200 years). This includes both Operational and Embodied Carbon. The accepted way of calculating this in the UK is the RICS (Royal Institute of Charted Surveyors) methodology which describes the life of a building as containing three stages: Stage A being manufacture and construction; Stage B being the building in use; and Stage C being end of life. Stage D relates to carbon benefits from re-using materials and components after end of life and is separately reported. This is the RICS table that sets out these stages:

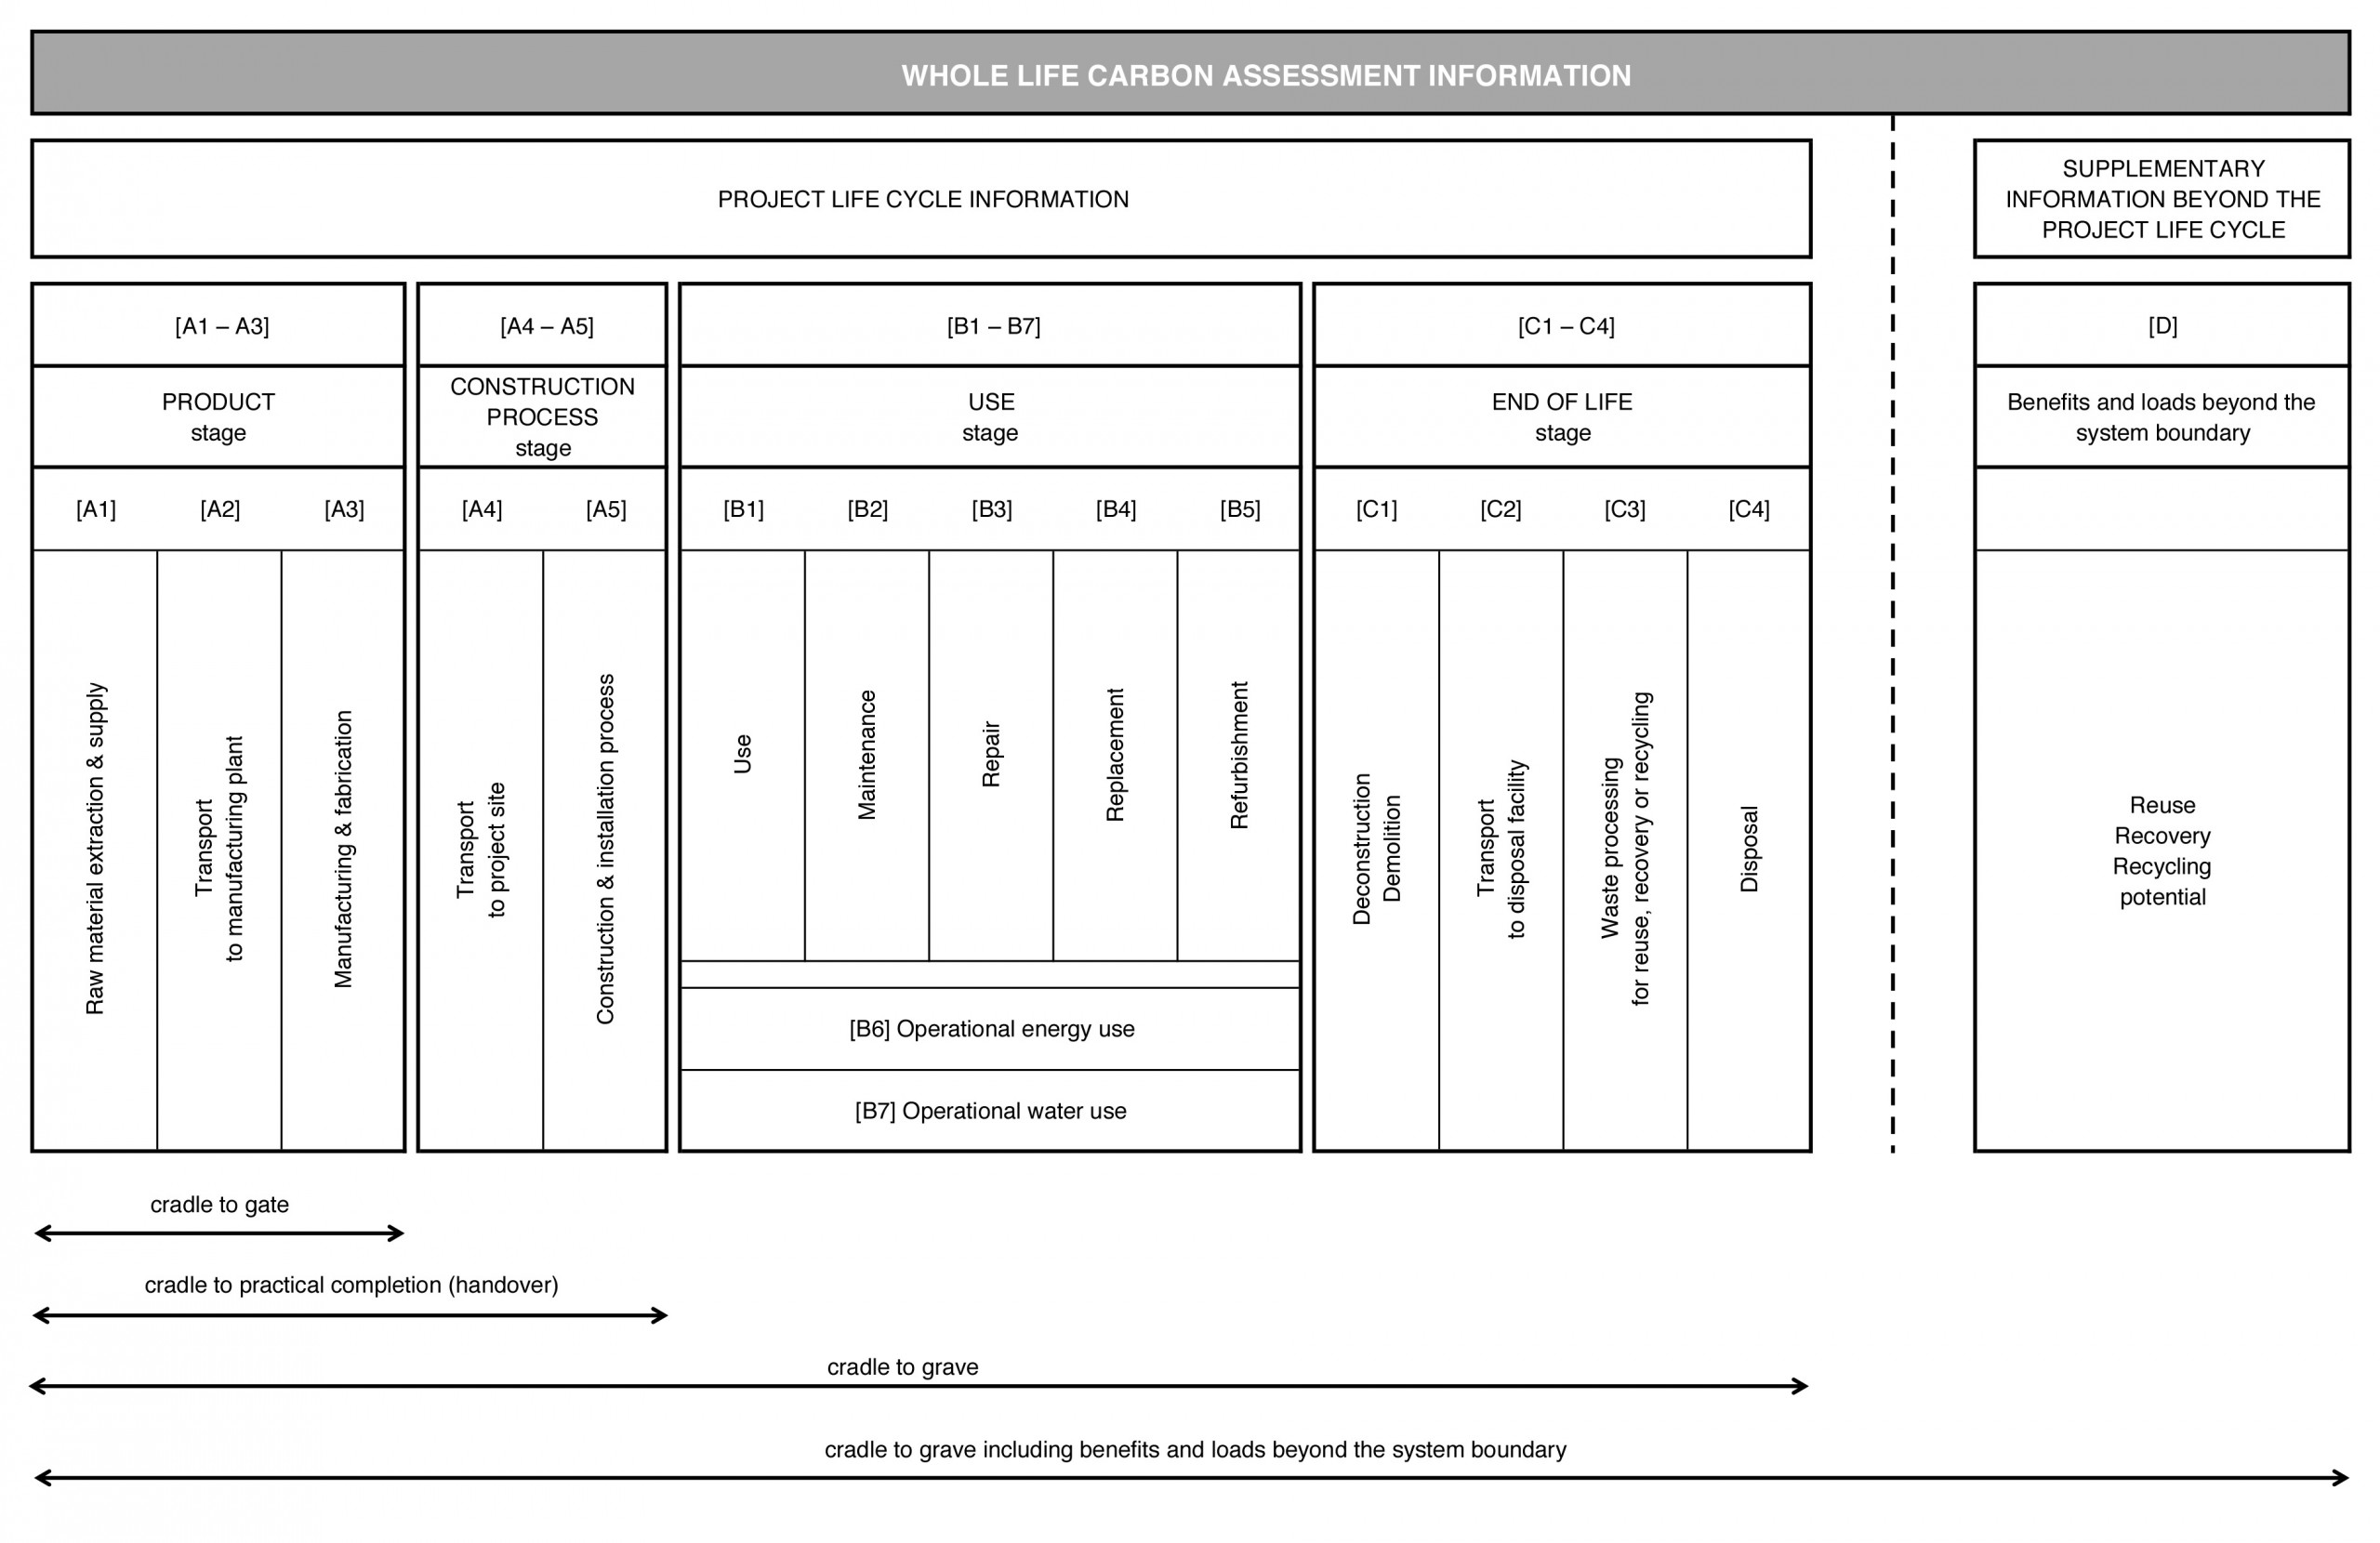
The units of measure for Whole Life Carbon are the same as those for Embodied Carbon, kgCO2eq/m2. ie the CO2 impact of a project per GIA m2 over a 60 year lifespan. In theory as are aiming for Net Zero by 2050, the operational carbon emissions of a building should be getting to zero in the UK within 20 years, which means that the key impact of a WLCA will be embodied carbon over the lifetime of a building. Because of this quite often the WLCA figure quoted excludes operational carbon (stages B6 and B7 in the above table). Your Architect, Quantity Surveyor or Sustainability Consultant should be able to calculate your project’s WLCA, although there are also specialist consultants.
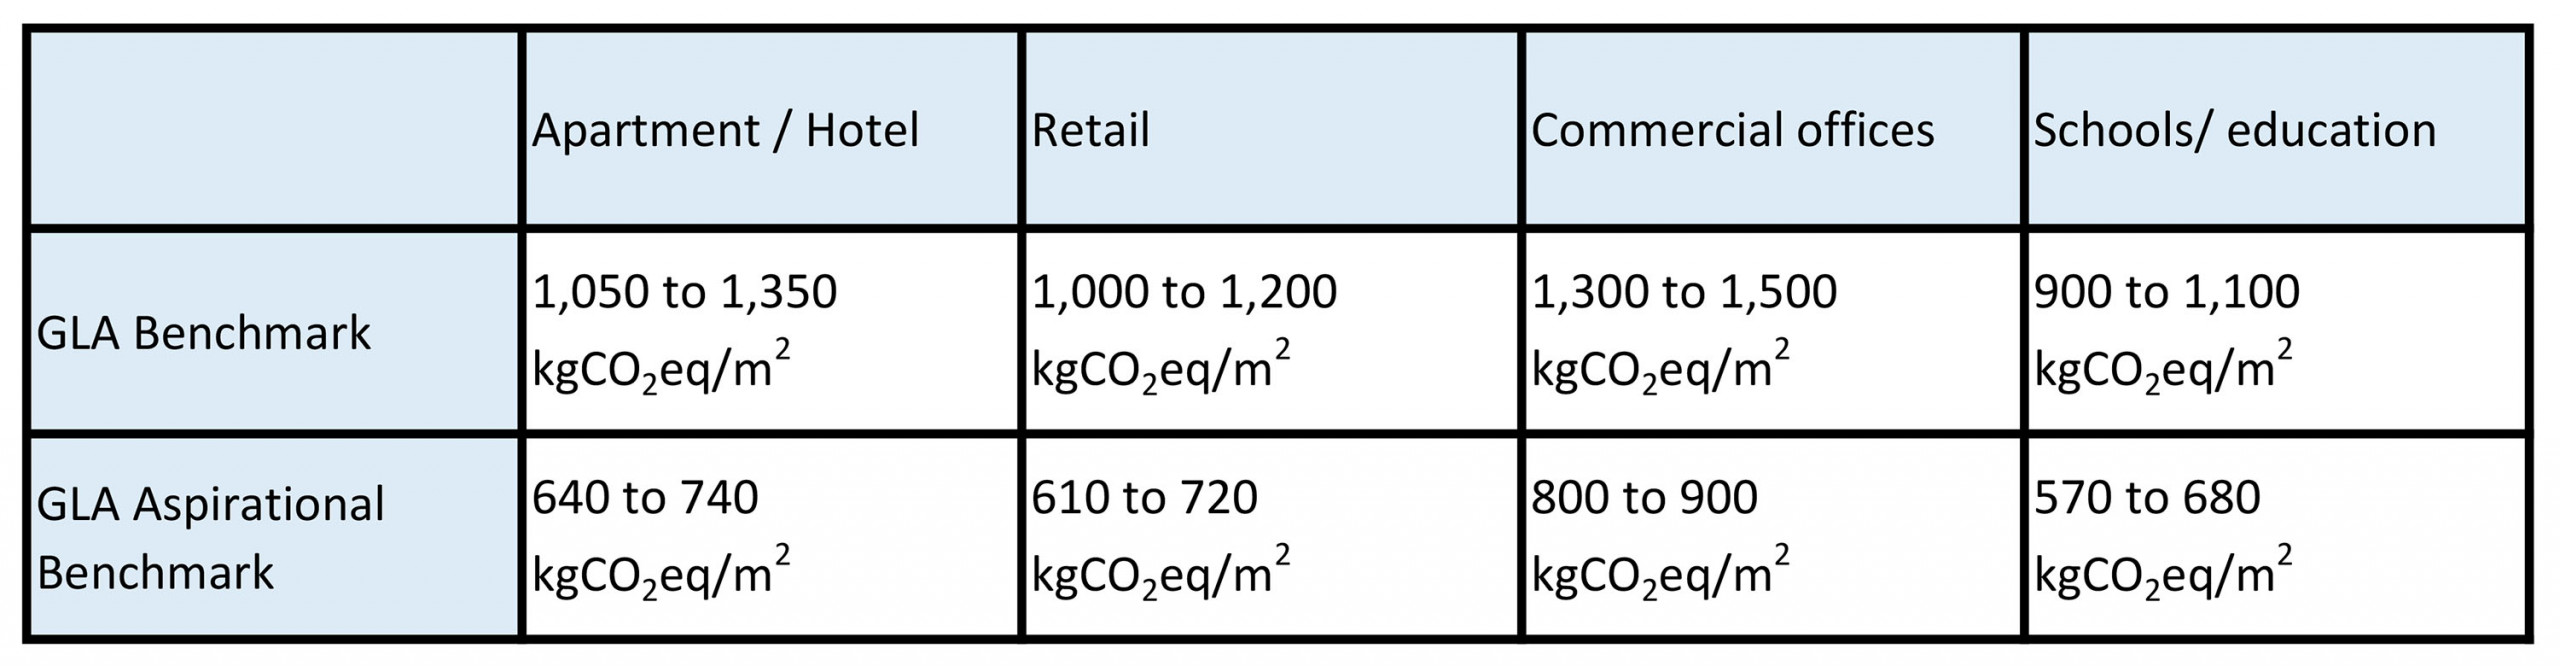
It is now mandatory to submit a Whole Life Carbon Assessment for larger planning application in London. Below are the targets set by the Greater London Authority (GLA) which exclude operational carbon (ie stages B6 and B7):

6) Potable Water Use
Energy and carbon are not the only metrics which describe a project’s impact. Despite recent flood events water is an increasingly limited resource, and water usage and drainage also have a carbon impact that is included in the operational element of a WLCA (from the previous section). Water usage for buildings is generally described in units of l/p/day; the number of litres of potable (ie potentially drinkable) water consumed by one occupant of the building per day. In education buildings the unit of measure tends to be m3/pupil/yr; cubic metres of potable water consumed by one pupil over the course of a year, as the occupation of such buildings is not consistent.
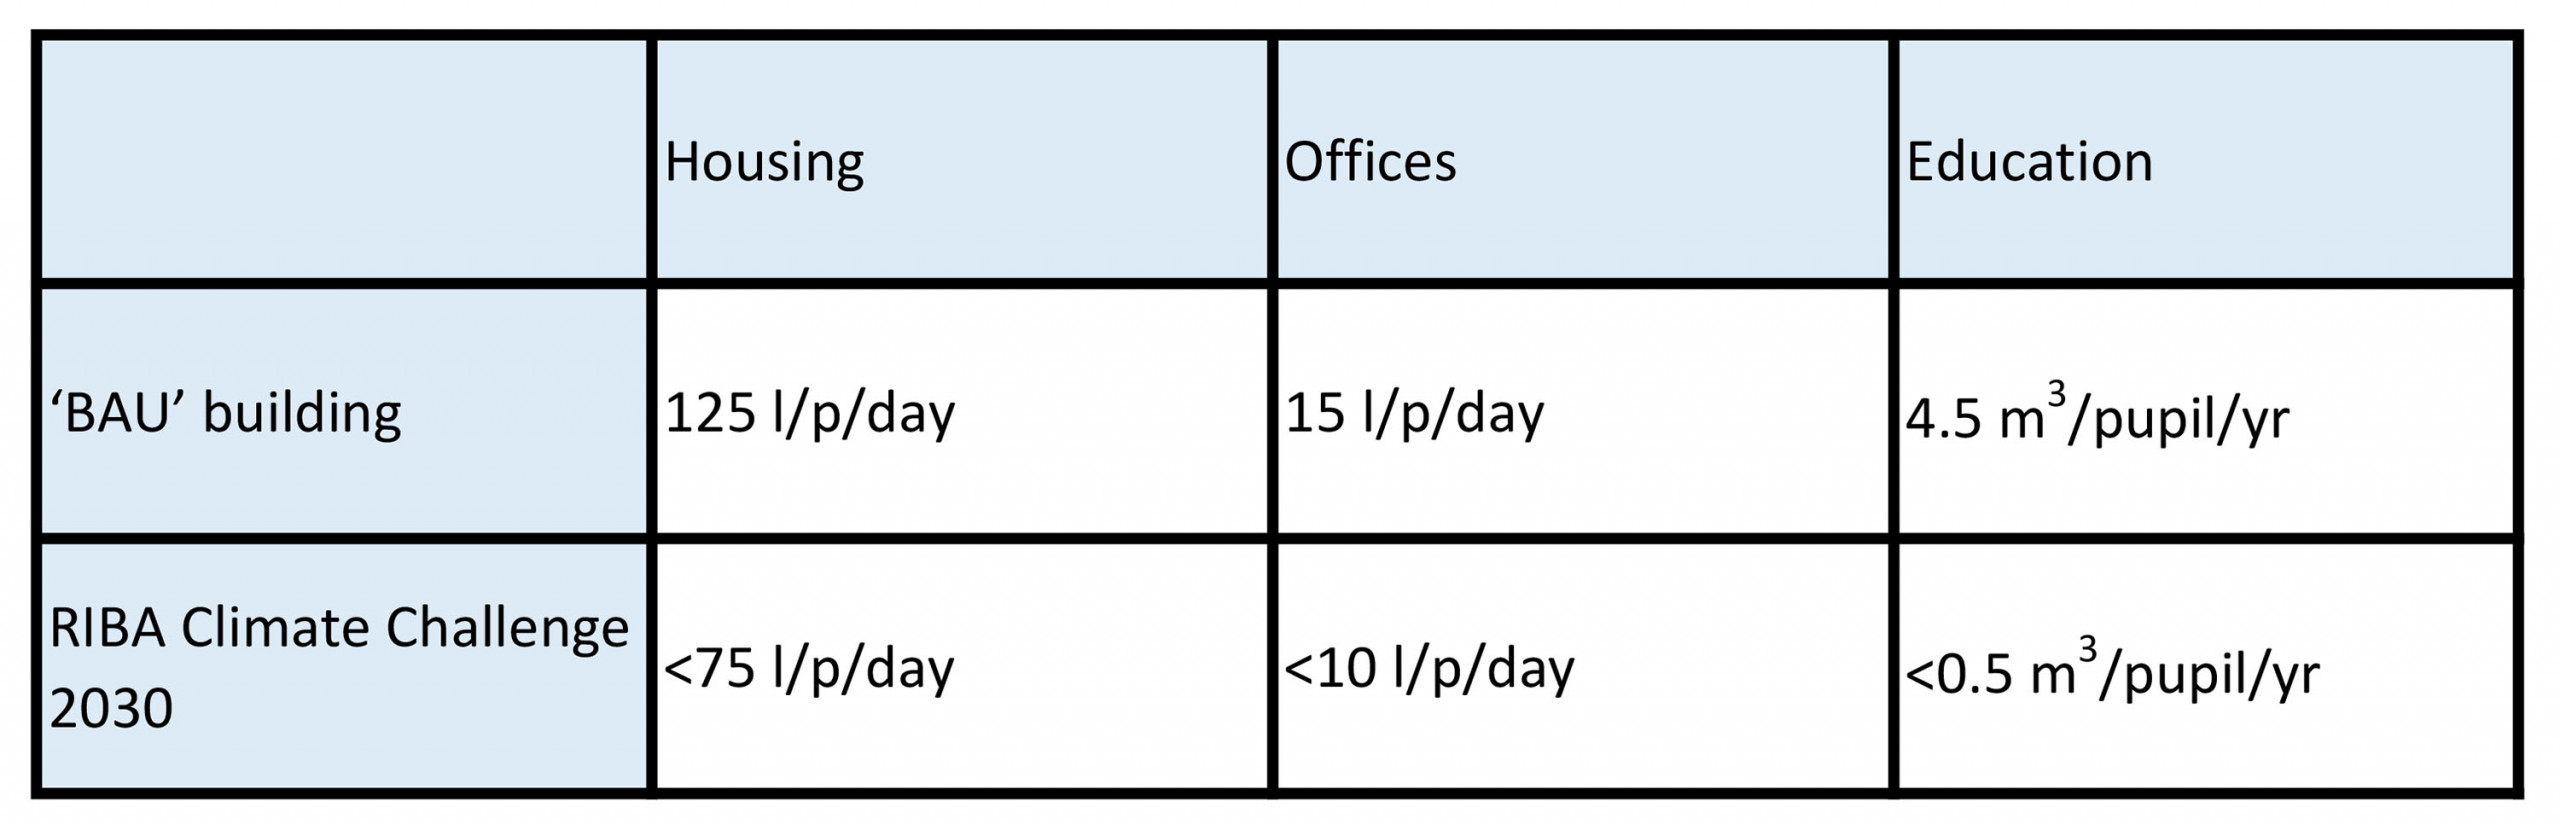
The amount of potable water consumed by a building depends on the flow rate of the water fittings and the appliances, capacity of baths, as well as whether there is any greywater or waste water recycling. Below are targets for Potable Water Use comparing a Business as Usual (BAU) building / project with the RIBA Climate Challenge 2030 figures:

In England there is a defined way of calculating this which is set out in Appendix A of Building Regulations Approved Document G. Your Architect or MEP/Sustainability Consultant should be able to assist you with this calculation. Once the project is completed you should be able to use meter readings to check the actual Potable Water Use figure.
7) Biodiversity Net Gain
The last metric is an increasingly important measure of a project’s positive relationship with the wider environment. Human activity has caused a steep drop in biodiversity and data shows that in the UK alone there has been a 19% decline in numbers of species since 1970. Every building project is an opportunity to reverse this trend. Biodiversity Net Gain (BNG) is the percentage increase of ‘biodiversity units’ on a site, these are species habitats; how a habitat makes up a unit is defined by their size, quality, location and type. Net gain is calculated as the percentage biodiversity increase as follows:
- The proposed biodiversity units on a site
- Divided by the existing biodiversity units on a site before any development
This means that if, for example, there are habitats lost as part of a development (like a tree) the additional habitats you are providing on a site would have to compensate for this loss before they contributed to the net gain.
At the moment in the UK mandatory 10% targets for Biodiversity Net Gain are being introduced which by April 2024 will be required for all planning applications. There is a standard method of calculating Biodiversity Net Gain which is a downloadable Excel spreadsheet available on the government website. However you will need an qualified Ecologist to assist you with the calculation as knowledge of the all the different UK natural habitats is a very expert area.
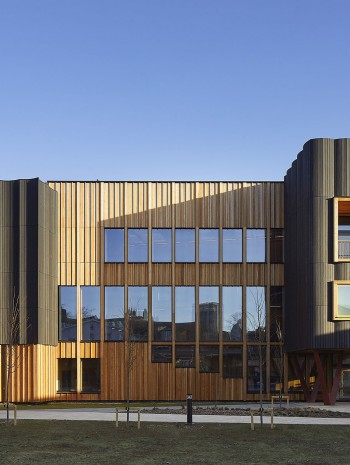
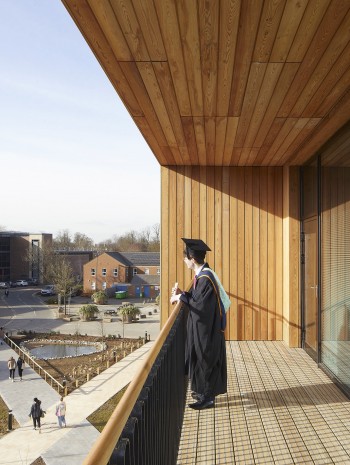
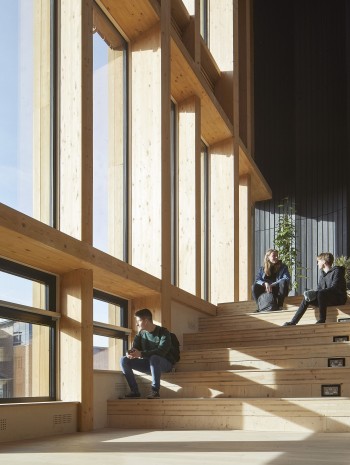
In terms of best practice, what you can achieve as a BNG target will vary depending on the nature of your site. We recently achieved a 53% increase at the York St John University Create Centre for example, which is located in the centre of York. If there really is no scope on your site there are a number of offset options available from creating habitats off site or buying ‘statutory biodiversity credits’ from the government.
Conclusion
Hopefully this gives you a good guide to the technical metrics that are often used to describe a project, and what best practice looks like. As I mentioned at the start of this article it is important to bear in mind that these are certainly not the ultimate measure of a project’s success. Community and social value are just as important and as a client you will inevitably judge a project more on how many people love it and want to rent it / buy it / use it.
Jerry Tate
Director

Jerry founded Tate+Co in 2007 and maintains a central role at the practice. He is driven by his desire to generate creative, pragmatic and unique solutions for each project that have a positive impact on our built and natural environment. Jerry is influential across all projects, ensuring design quality is paramount.
Jerry was educated at Nottingham University and the Bartlett, where he received the Antoine Predock Design Award, subsequently completing a masters degree at Harvard University, where he received the Kevin V. Kieran prize. Prior to establishing Tate+Co, he worked at Grimshaw Architects where he led a number of significant projects including ‘The Core’ education facilities at the Eden Project in Cornwall, UK.
Jerry is an active member of the construction industry community and is a fellow of the Royal Society of the Arts. He is frequently invited to lecture, notably at Education Estates, the Carpenters Fellowship and Ecobuild, as well as contribute to architecture publications, including the Architects Journal, Building Design, Sustain, and World Architecture News. He has taught at Harvard University, run a timber design and make course for the Dartmoor Arts organisation and was Regnier Visiting Professor for Kansas State University’s Architecture School in 2021/22. Currently Jerry teaches at the Bartlett School of Architecture, UCL. In his spare time Jerry is involved with a number of charities and is a trustee at the Grimshaw Foundation as well as a Governor at Cranleigh School.